Instructions

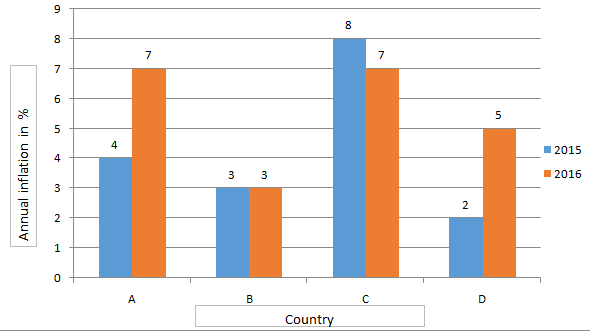
The bar graph shows annual Inflation in two years 2015 and 2016 of four countries (A, B, C, D). Study the diagram and answer the following questions.

Solution
In country C, inflation in 2016 was lower than 2015
So the answer is option A.
Create a FREE account and get:
- Free SSC Study Material - 18000 Questions
- 230+ SSC previous papers with solutions PDF
- 100+ SSC Online Tests for Free


