Answer the questions based on the following information.
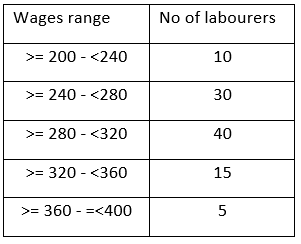
The following bar diagram represents the number of daily wages (in rupees) of 100 labourers in different wage classes on a construction site. Here the class interval a-b includes all wages (in rupees) greater than or equal to a and less than b except for the interval 360-400, where both the end points are included.
No.of labourers

Wages in Rupees
Let's tabulate the information in the graph ,we get

No. of labourers who receive a wage less than 250 will be at least 10 but not more than 40 in which case all the people in the range 200-240 will be receiving a wage less than 250.
So if all the people in the range >= 240 - <280 are included then to a maximum there will be 40 labourers to whom the wage will be less than 250.
Hence B is the correct answer.
Create a FREE account and get:
- All Quant Formulas and shortcuts PDF
- 40+ previous papers with solutions PDF
- Top 500 MBA exam Solved Questions for Free


