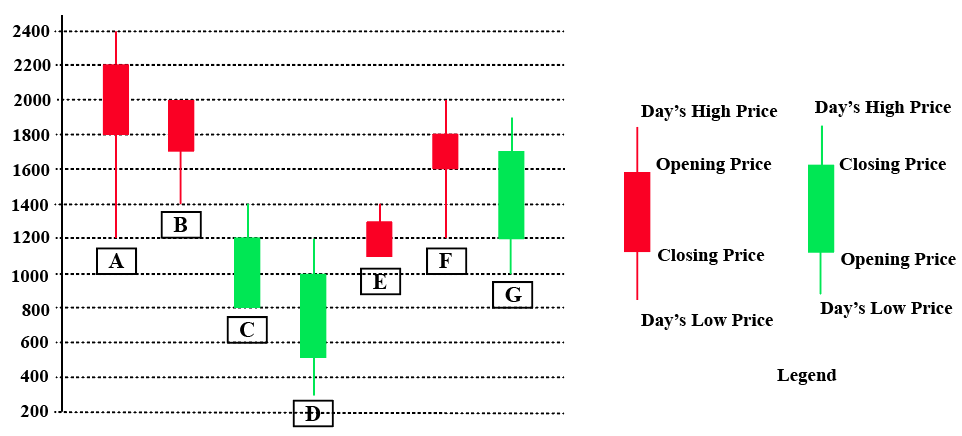
The chart below shows the price data for seven shares - A, B, C, D, E, F, and G as a candlestick plot for a particular day. The vertical axis shows the price of the share in rupees. A share whose closing price (price at the end of the day) is more than its opening price (price at the start of the day) is called a bullish share; otherwise, it is called a bearish share. All bullish and bearish shares are shown in green and red colour respectively.

Daily loss for a share is defined as (Opening price - Closing price) / (Opening price). Which among the shares A, B, F and G had the highest daily loss on that day?
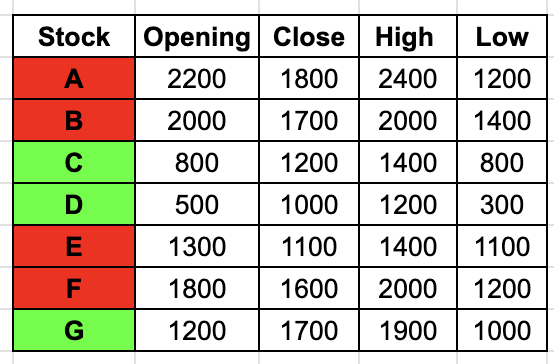
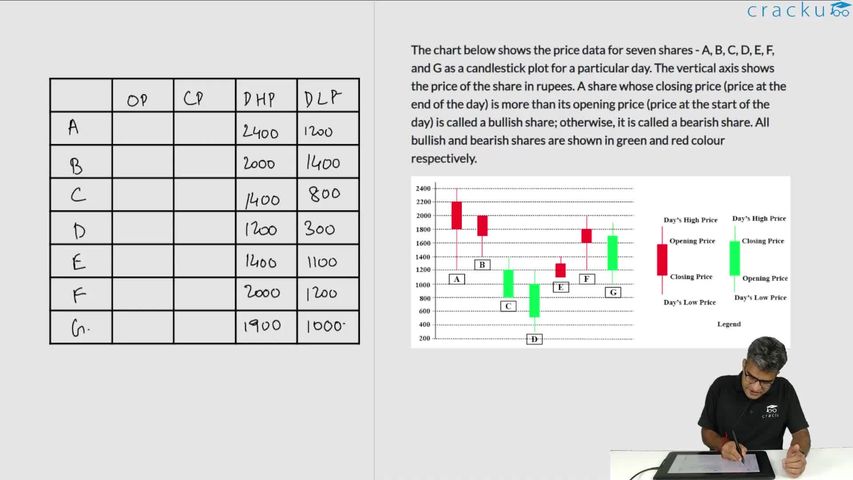
Writing down the values given in the candlestick chart in the form of a table for ease of calculation,

Daily loss for a share is defined as (Opening price - Closing price) / (Opening price)
Calculating this for the options:
Stock A: 400/2200=2/11
Stock B: 300/2000=3/20
Stock F: 200/1800=1/9
Stock G gained money that day
Hence Stock A has the highest Daily Loss.
Video Solution

Create a FREE account and get:
- All Quant CAT complete Formulas and shortcuts PDF
- 38+ CAT previous year papers with video solutions PDF
- 5000+ Topic-wise Previous year CAT Solved Questions for Free


