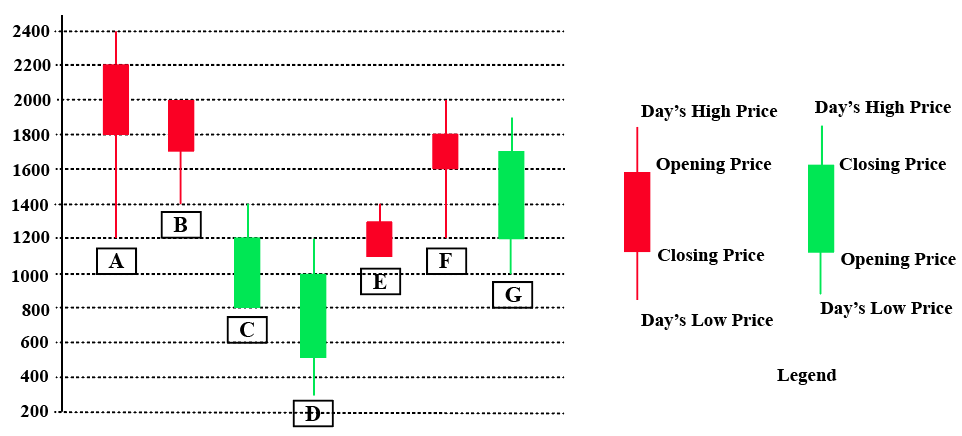
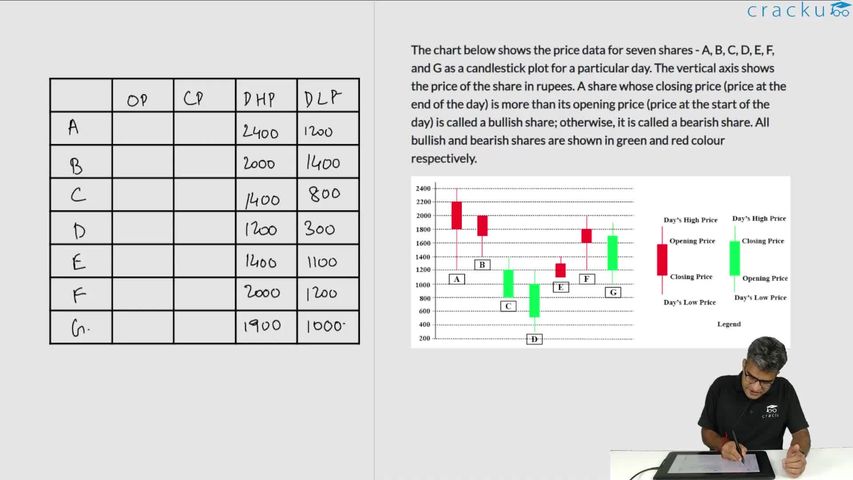
The chart below shows the price data for seven shares - A, B, C, D, E, F, and G as a candlestick plot for a particular day. The vertical axis shows the price of the share in rupees. A share whose closing price (price at the end of the day) is more than its opening price (price at the start of the day) is called a bullish share; otherwise, it is called a bearish share. All bullish and bearish shares are shown in green and red colour respectively.

What would have been the percentage wealth gain for a trader, who bought equal numbers of all bullish shares at opening price and sold them at their day’s high?
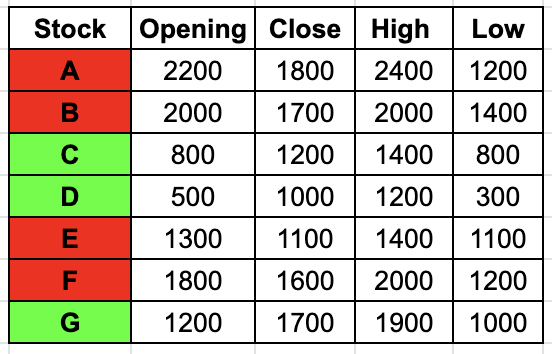
Writing down the values given in the candlestick chart in the form of a table for ease of calculation,

There are three bullish shares, C D and G
Lets say a trader buys one share of each of these stocks, and sells them at their day's high
One share of C at opening is 800, sells at 1400
One share of D at opening is 500, 1200
One share of G at opening is 1200, 1900
Total Investment is 2500, and total money after selling is 4500
That is an 80% return since, $$\dfrac{\left(4500-2500\right)}{2500}=0.8$$
Video Solution

Create a FREE account and get:
- All Quant CAT complete Formulas and shortcuts PDF
- 38+ CAT previous year papers with video solutions PDF
- 5000+ Topic-wise Previous year CAT Solved Questions for Free


